By the numbers: how the school aid budget proposals affect students
[Corrected: revised weighted average figures for each plan.] Each year, we try to bring some clarity to the school aid budget debate by showing how it affects students around the state. How many students are going to receive how much of an increase (or cut)? How many students will have their school's funding keep up with inflation? How do the proposals shake out for low-income students in particular? The graphs attached to this article are one way of trying to answer that question.
First, a general overview: By law, the state's top economists must use their financial projections to generate target changes in the per-pupil foundation allowance funding for the next year. The legislature is not bound by these calculations, and so far they have chosen to ignore them every year since 1994. This year is no exception.
In the most recent revenue estimation meeting, state economists determined that, given likely changes in available revenue and school enrollment, the foundation allowance should increase by 3.4%, or $252 per pupil.
In contrast, the three current budget proposals (the governor's, the House-passed version and the Senate-passed version) each yield a weighted average per-pupil funding increase of between $150 and $190 for next year (taking all funding changes into account), representing an average increase of a little over 2%. Meanwhile, the revenue conference estimated that inflation will be about 2.3% for the twelve months ending in June 2018, outstripping the funding made available to districts under most of the plans.
However, the devil is in the details, as the saying goes, and it's the details behind these three plans which determine their impact on Michigan students.
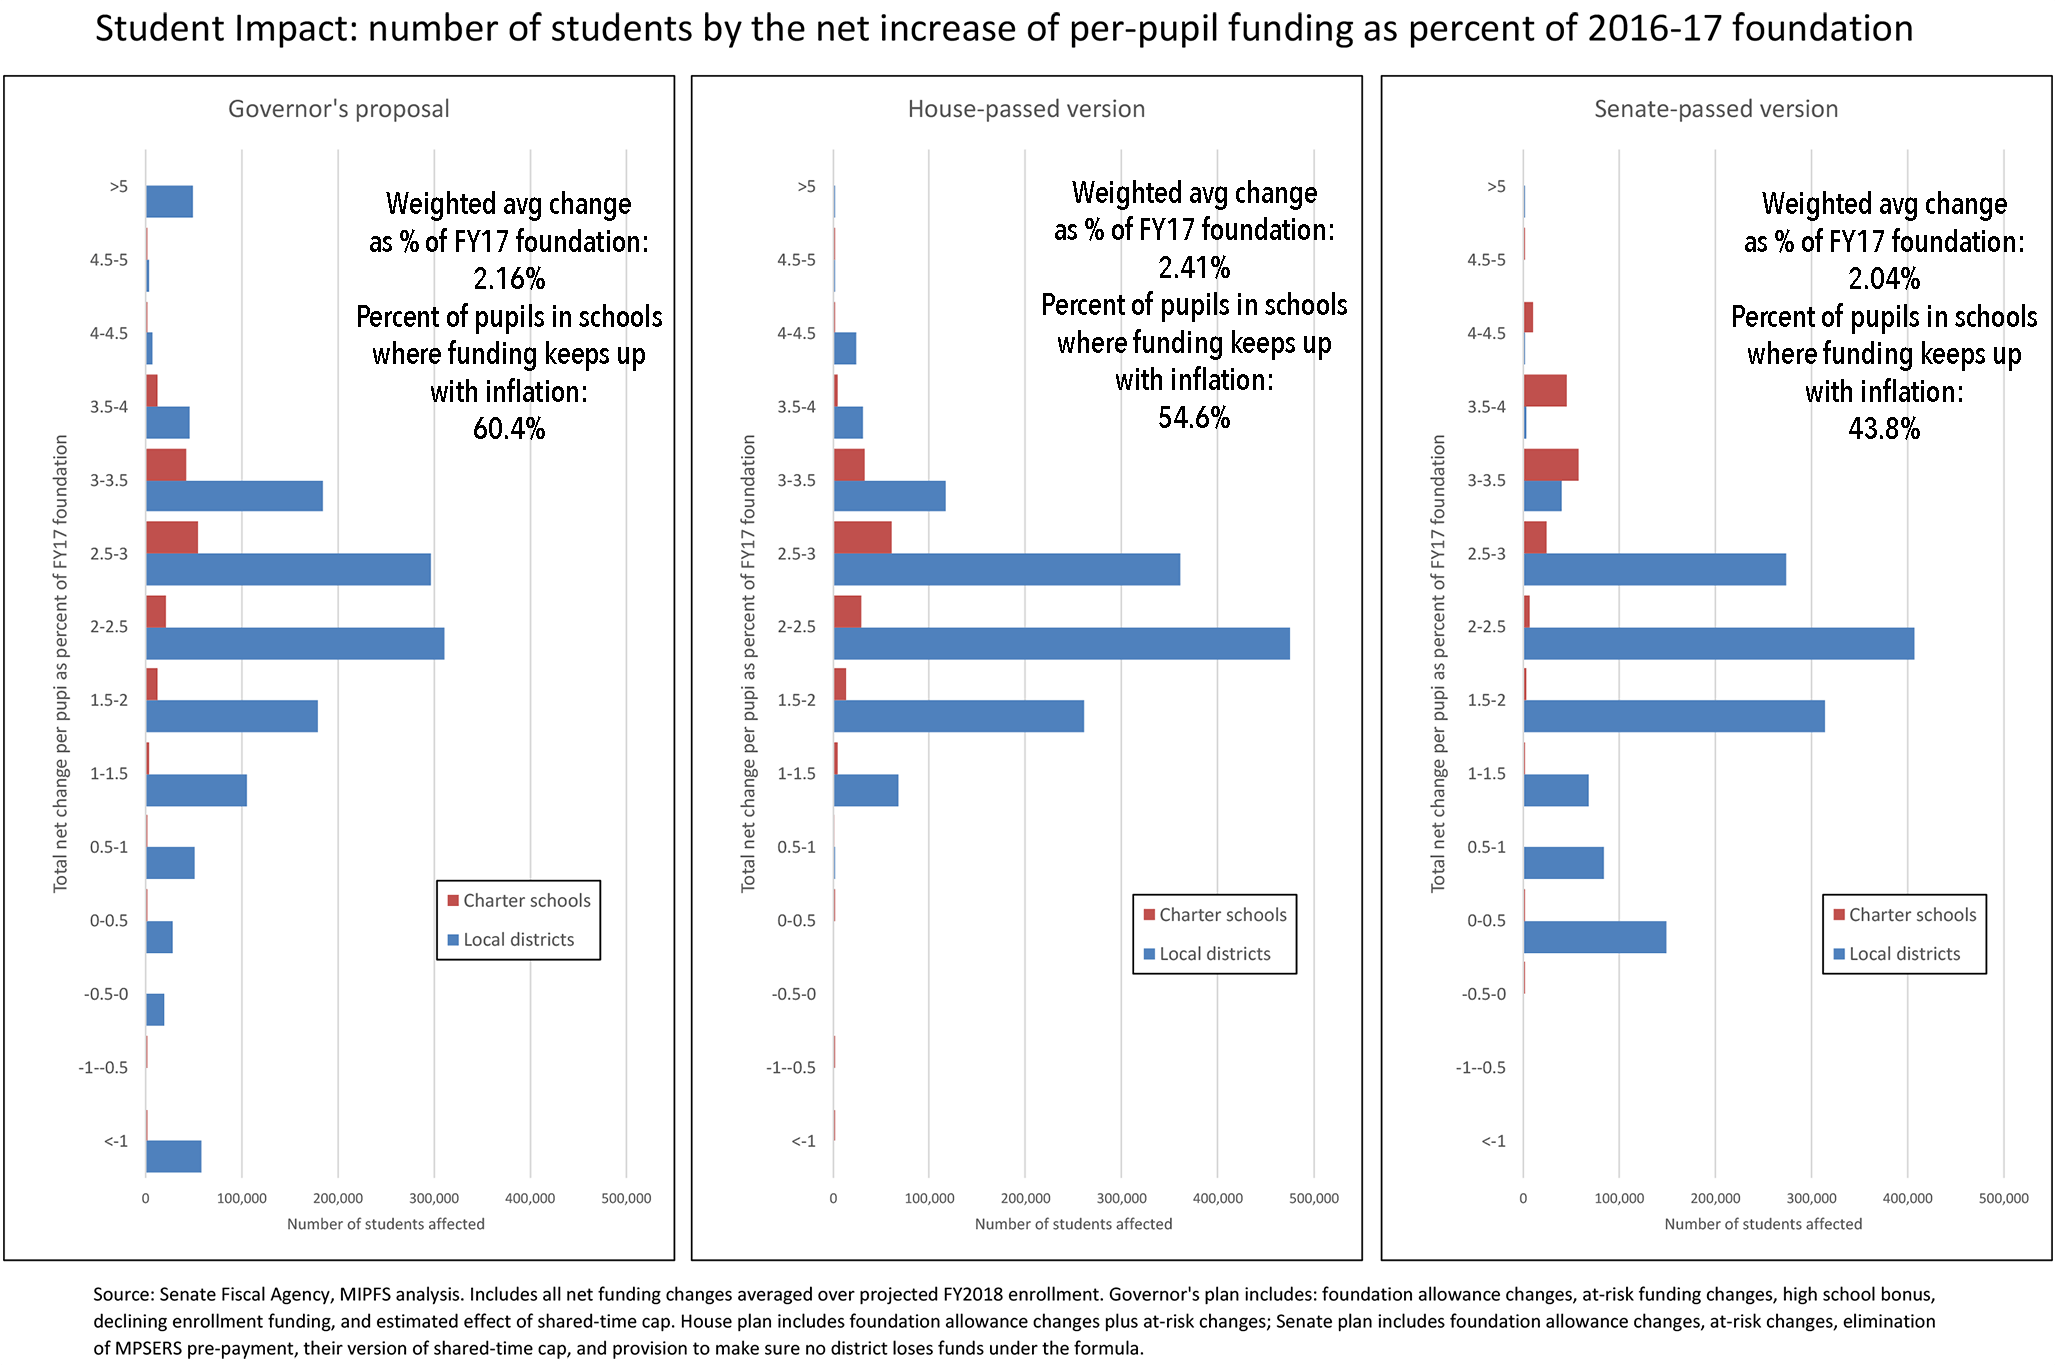
The graphic below shows the net dollar impact of each plan on students across the state (click on the image for a larger version). Specifically, it sums up all the major changes made in the budget and averages that over the projected number of pupils in each district next year (though some funding is not calculated on a per-pupil basis). Each horizontal bar indicates the number of students attending districts at each level of dollar change. Local public school students and charter school students are shown separately, to examine how proposals affect different types of schools.

The Governor's proposal has the widest range: this is partly because of significantly higher spending on "at risk" (Section 31a) pupils, and also cuts to "shared time" programs (used predominantly by a small number of districts) and the proposed 80% limit on the funding of cyber charter schools. This plan sits between the two others in terms of increases in direct funding, with a weighted average increase of $169.85 per pupil.
The House plan has a smaller range than the executive recommendation, and a somewhat higher weighted average increase of $187.32 per pupil. The House plan eliminates the high school bonus, the cyber charter limits, and the shared time limits, but keeps most of the at-risk funding and gives all districts a flat $100 increase (compared to the other two, which use the 2x formula).
Finally, the Senate plan demonstrates a significantly lower spread of increases, and required a "hold harmless" amendment made on the floor to prevent many districts from getting a reduction. The average per pupil increase is the lowest of the three, at $154.92 per pupil. The Senate bill also drops most of the Governor's changes, and also eliminates the $100 million in pre-payment of retirement system liability costs, instead using it to boost the per pupil increase. As a result, charter schools (which are rarely MPSERS participants) get the full, higher, per pupil funding, while local districts' increase is offset by higher MPSERS costs they would have to pay. At risk payments to "hold harmless" districts are more sharply limited under this plan as well.
The same pattern is shown in the second chart, which displays the number of students getting various funding changes as a percent of the current year foundation allowance. All but one of the weighted averages (2.16%, 2.41%, and 2.04%, respectively) are below the projected level of inflation for 2017-18, estimated at 2.3%, with the House plan coming just above projected inflation. However, under the Governor's plan, about 60% of students attend districts whose funding will keep up with inflation; the numbers for the House and Senate plans are 55% and 44%, respectively.
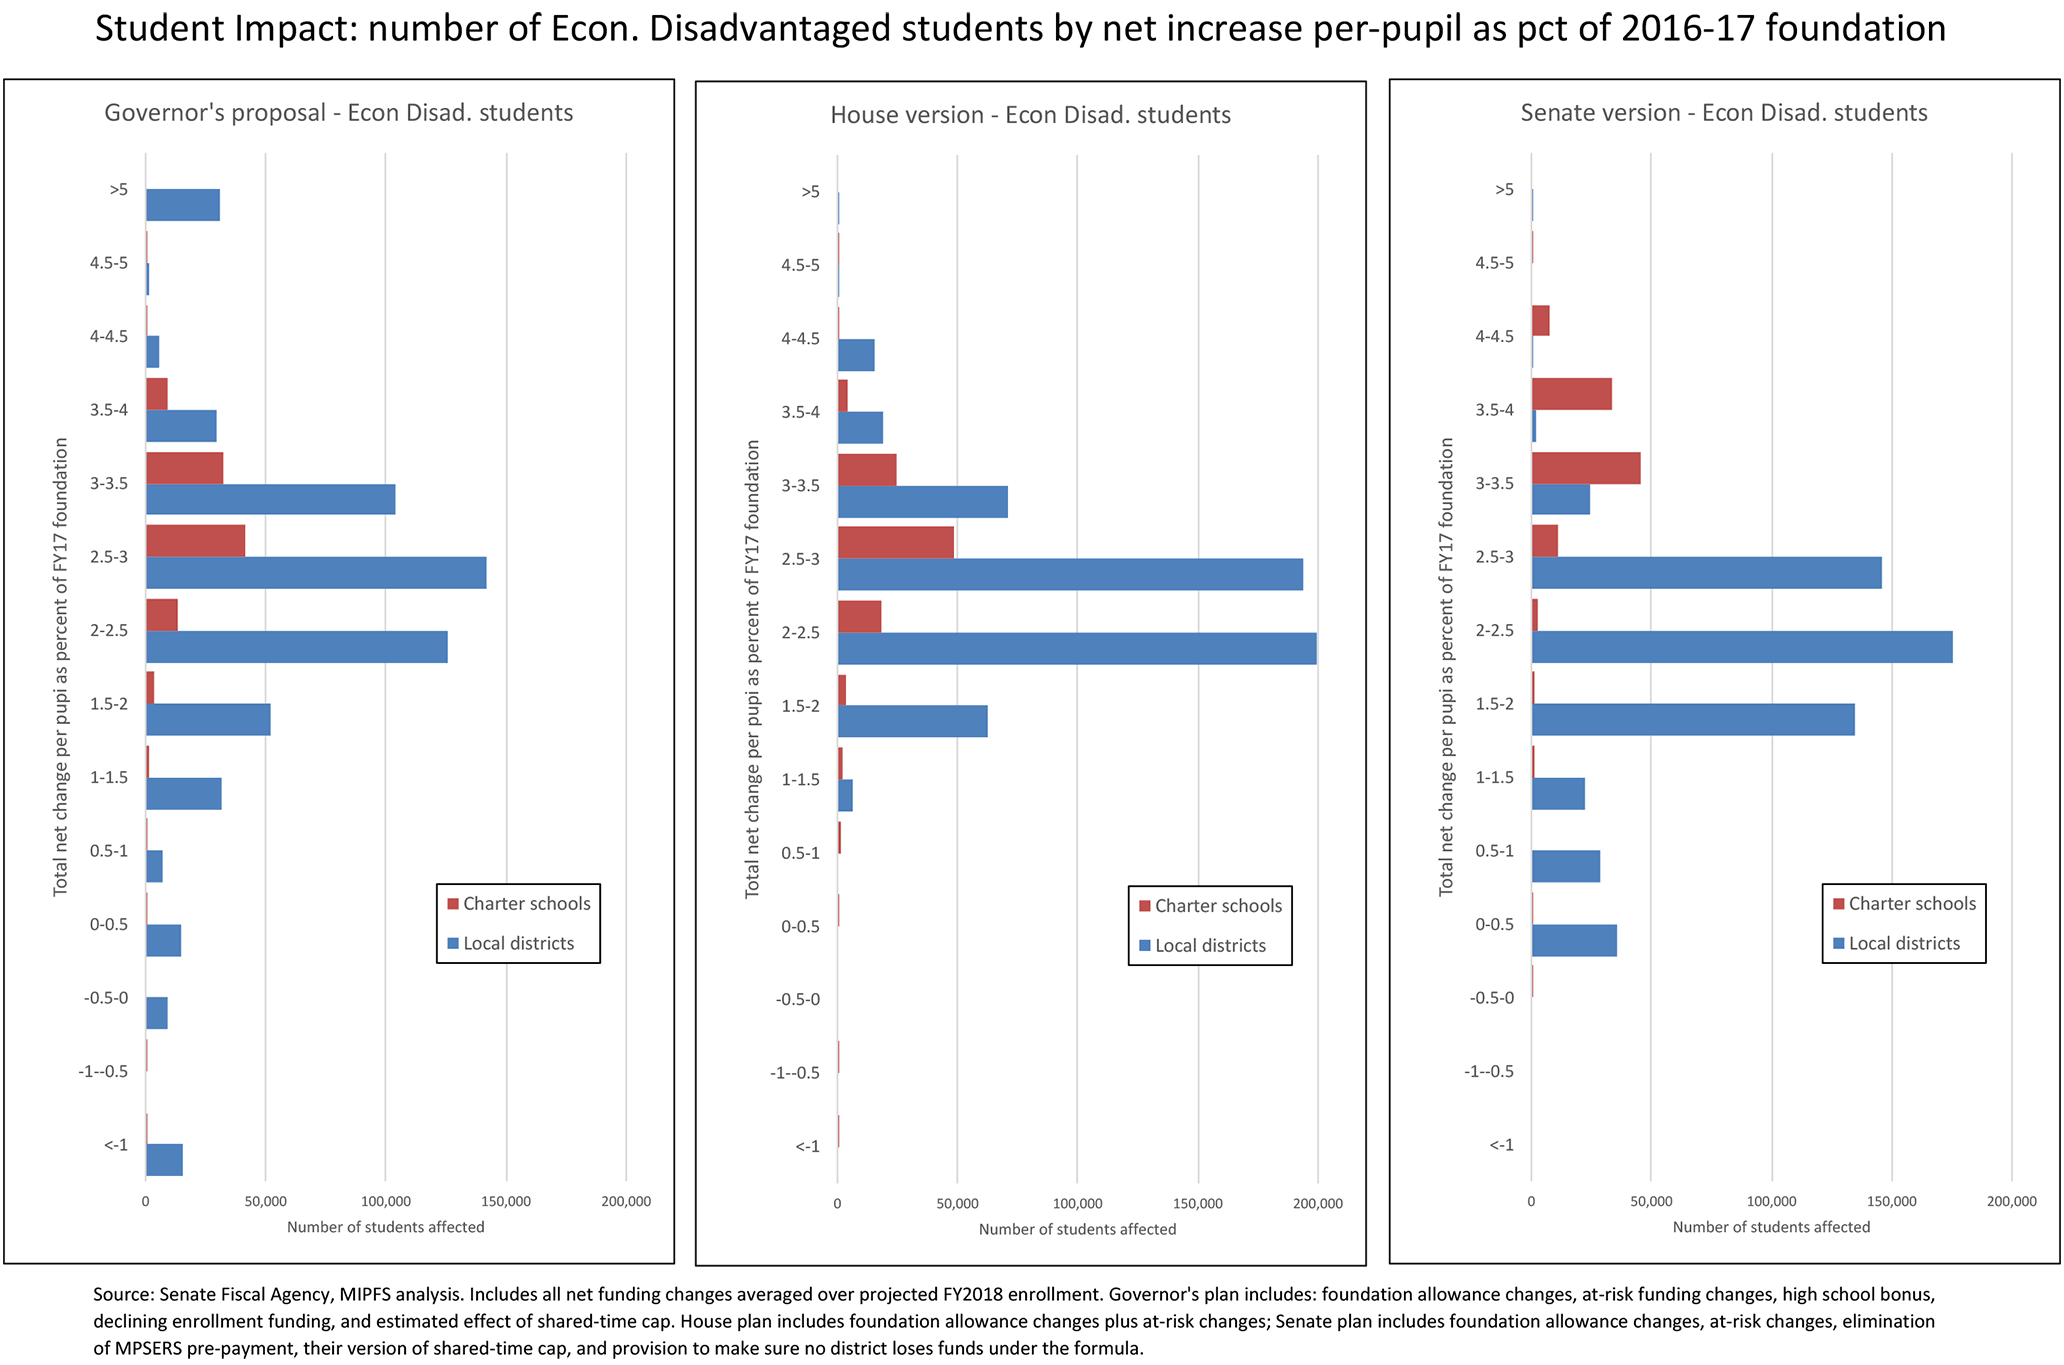
Finally, the third chart is the same as the second, except it shows numbers of economically disadvantaged students at each level of percent increase or cut. "Economically disadvantaged" is defined as students who qualify for free or reduced-priced lunch, and is commonly used as a proxy for poverty (though it is a very problematic one). Here, the Governor's plan shifts a little higher than the House plan (because of higher at-risk spending), while the Senate plan is notably lower and shows a distinct advantage for charter school students.
The Governor's plan is not reflected in any of the spending bills now in the legislature, but since the House and Senate must hammer out a compromise bill, many items can change and the final result need not look much like any of the earlier plans. However, by the time a proposed compromise bill is made public (as a conference committee report), all the deals will have been cut and school advocates will have no ability to affect the process. Comments, concerns and suggestions need to be sent to legislators now to have any chance of influencing the outcome.
- Log in to post comments